Sales Forecasting Accuracy: 7 Reasons Your Salesforce Forecast Is Wrong (and How to Fix Them)
If your team forecast $5 million in quarterly bookings and closed $4.2 million, poor sales forecasting accuracy is no longer an abstract metric. It is an $800,000 gap that someone must explain to the CEO, a hiring plan built on revenue that never arrived, and a Finance team quietly asking why the CRM and the books disagree. This article shows how to measure forecast accuracy properly, separate the miss caused by customers from the miss caused by Salesforce data, and work through seven common causes with a reconciliation checklist your RevOps and Finance teams can use together.
A familiar quarter: Jane's $800,000 question
Consider a hypothetical example. Jane is VP of Sales at a mid-market software company. On July 1 her Salesforce forecast showed $5.0 million in Q3 bookings. The quarter closed at $4.2 million.
Jane now has several uncomfortable questions at once. Was the team too optimistic, or was the data wrong? Did the company hire and spend against revenue that was never real? Why does Finance report a different number from the sales dashboard? And can anyone trust next quarter's forecast?
Those questions matter because they point to different owners and different fixes. Most forecast misses mix three kinds of problem:
- Commercial uncertainty. A customer freezes a budget, changes scope or negotiates different terms. No software removes this.
- Forecasting process weaknesses. Inconsistent stage definitions, optimistic probabilities and close dates that nobody challenges. Better governance and review habits help here.
- Technical and data defects. Duplicate opportunities, stale records, integration updates that never arrive and amounts that no longer match the signed order. These can usually be found, measured and corrected.
Forecast accuracy is not only a reporting problem. It is a management decision problem with financial consequences, and the first job is to work out which of these three problems you actually have.
What is sales forecasting accuracy?
Sales forecasting accuracy measures how closely a forecast made at a specific point in time matches the actual result for the same measure and period. Three choices have to be agreed before the number means anything:
- The measure. Bookings (signed contract value), billings (invoiced), cash collected and recognized revenue are different numbers and can legitimately differ.
- The snapshot date. A forecast taken on day one of the quarter is a different prediction from one taken in week ten.
- The formula. There is no single universal method, and the denominator changes the answer.
A common approach expresses error relative to the actual result:
Forecast error % = |Forecast − Actual| ÷ Actual
Forecast accuracy % = 100% − Forecast error %
For Jane: |$5.0M − $4.2M| ÷ $4.2M = 19.0% error, or 81.0% accuracy.
Some teams instead divide actual by forecast ($4.2M ÷ $5.0M = 84.0%). Others average the percentage error across several periods (mean absolute percentage error, or MAPE). None is wrong, but mixing them between meetings guarantees an argument. Pick one, write it down and keep using it.
Bias versus volatility
A single quarter hides an important distinction. Compare two fictional teams over three quarters, using the same error formula:
| Team | Q1 error | Q2 error | Q3 error | Average signed error | Average absolute error |
|---|---|---|---|---|---|
| Team A | +7.0% | +9.1% | +19.0% | +11.7% | 11.7% |
| Team B | −9.9% | +12.6% | −7.7% | −1.6% | 10.1% |
A positive number means the forecast was higher than the actual result. Both teams miss by roughly 10–12% on average, but Team A is consistently optimistic. That is bias, and it usually points to stage definitions, probabilities or pipeline hygiene. Team B misses in both directions, which suggests timing volatility or a small number of large deals swinging each quarter. The fixes are different, which is why measuring signed error as well as absolute error is worth the extra column.
Forecast accuracy is not quota attainment
Quota attainment compares results with a target set in advance. Forecast accuracy compares results with a prediction. A team can miss quota and forecast accurately, which is useful information for planning, or beat quota with a wildly wrong forecast, which still disrupts hiring and cash plans.
Why accuracy matters to the people who use the forecast
A forecast becomes expensive when it drives commitments:
- Hiring and spending. Headcount, marketing budgets and contractor spend are often approved against expected bookings. An optimistic forecast commits cost before revenue arrives.
- Delivery capacity. Implementation and support teams plan staffing around expected new customers. When deals slip, people sit idle; when they land unexpectedly, onboarding queues grow.
- Financial planning. Finance uses the sales forecast to plan cash and board guidance. A number that changes late forces rework and difficult conversations.
- Performance evaluation. Sellers and managers are judged partly on forecast calls. If the data underneath is wrong, the evaluation is unfair in both directions.
- Management time. When numbers disagree, senior people spend hours reconciling spreadsheets before a board meeting instead of making decisions.
- Credibility. After two or three unexplained misses, executives start discounting every forecast by gut feel, and the CRM becomes a system people update but no longer believe.
Sales Forecasting Accuracy: explaining an $800,000 miss
To show how this analysis works, here is a small synthetic example built for this article. The company, accounts and amounts are fictional. These are not Salesforce screenshots or results from a live system; the totals were calculated independently in a short script and shown as a chart.
The forecast measure is Q3 bookings: Commit and Closed Won opportunity amounts, taken from a snapshot on July 1. The actual measure is Q3 bookings from the order system, which Finance treats as the record of signed contract value.
| Opportunity (fictional) | July 1 forecast | Q3 actual bookings | What happened |
|---|---|---|---|
| Altamira Health: 2027 Platform Renewal (created by renewal sync) | $240,000 | $240,000 | Closed as expected |
| Altamira Health: Platform Renewal 2027 (created manually) | $240,000 | $0 | Duplicate of the renewal above |
| Brookfield Logistics: Fleet Analytics Rollout | $300,000 | $0 | Stale. Close date moved three times, no customer activity since March; closed lost in September |
| Cobalt Ridge Foods: Line Expansion | $350,000 | $290,000 | Amount not updated. Signed at $290,000 after a volume discount; the order integration updated status but not amount |
| Delmont Utilities: Grid Monitoring | $200,000 | $0 | Commercial. Customer budget freeze moved the deal to Q4 |
| Everleigh Clinics: Scheduling Suite | $180,000 | $180,000 | Closed as expected |
| Fairhaven Transit: Operations Dashboard | $130,000 | $130,000 | Closed as expected |
| All other Q3 opportunities (net, simplified) | $3,360,000 | $3,360,000 | Assumed to net out for readability |
| Total | $5,000,000 | $4,200,000 | $800,000 variance |
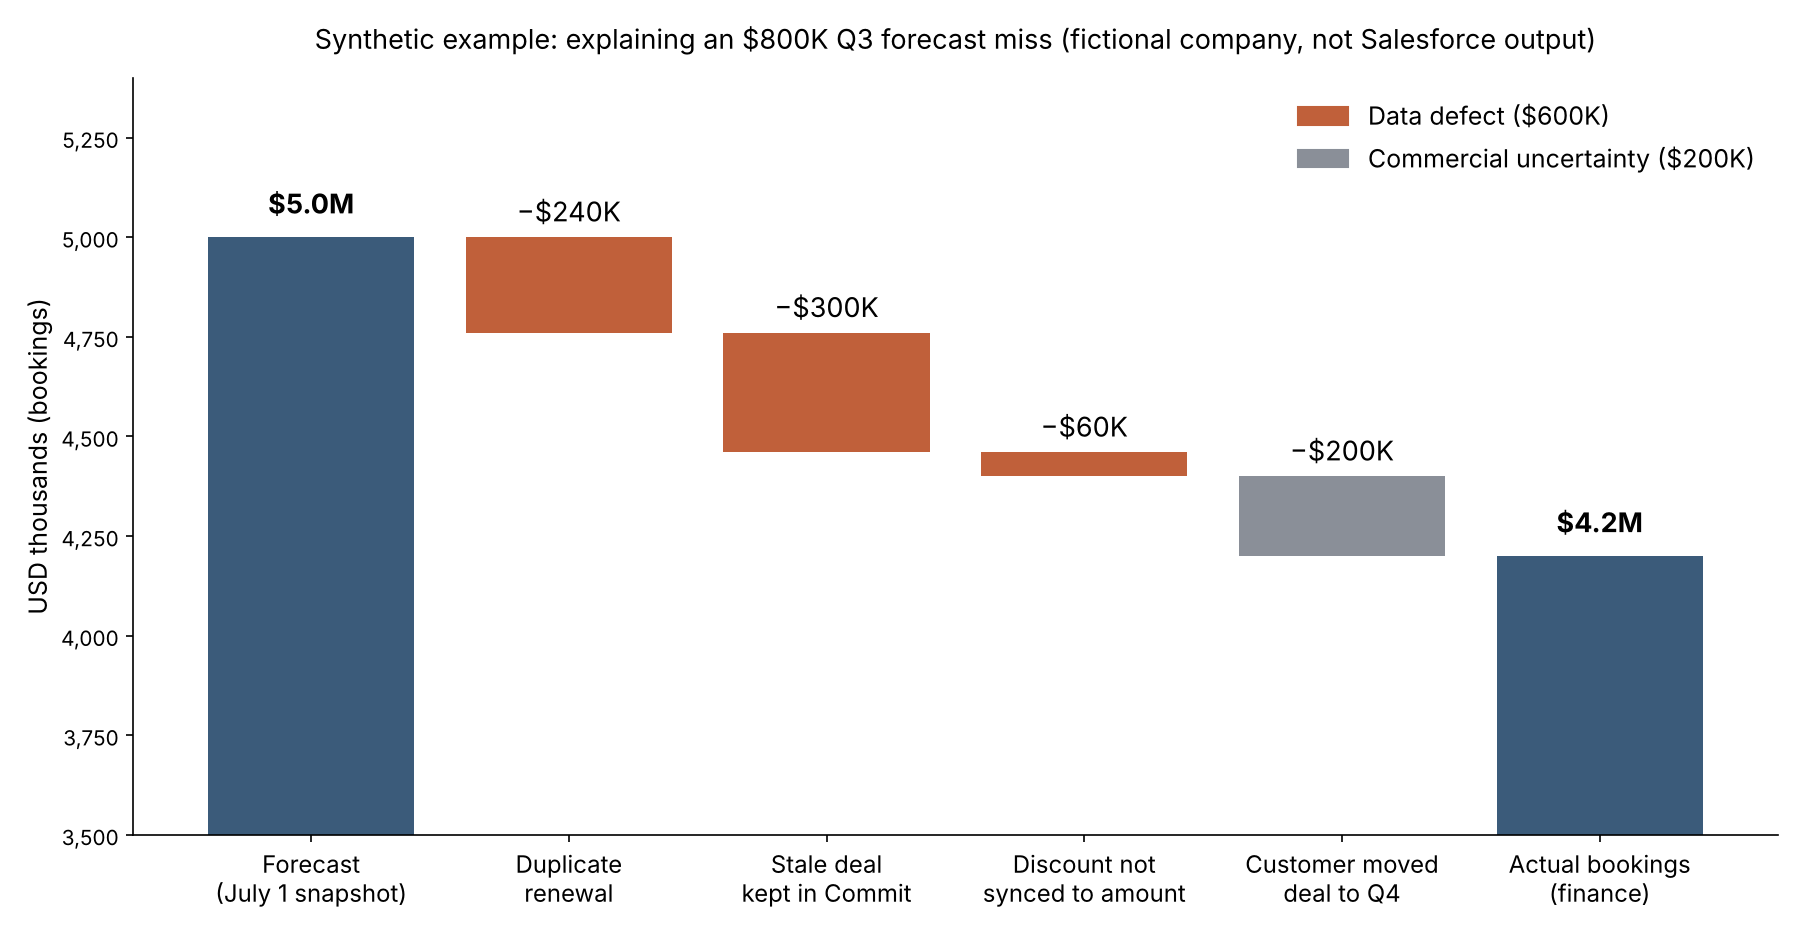
The diagnosis. Of the $800,000 miss, $600,000 traces to record problems that existed on July 1: a duplicate renewal ($240,000), a stale deal that should not have been in Commit ($300,000) and an amount that did not reflect the signed discount ($60,000). The remaining $200,000 is ordinary commercial uncertainty: Delmont's record was accurate when the forecast was taken, and the customer changed its timing.
The controlled correction. Correcting the three defective records would have produced a July 1 forecast of $4.4 million rather than $5.0 million. In practice that means merging or closing the duplicate with a note, moving the stale deal out of Commit after a documented review, and fixing the integration so the signed amount updates the opportunity.
The limitations. This is hindsight. A cleaner forecast is not automatically a more accurate prediction, and correcting records after the quarter does not recover any revenue. The value is in the split: Jane can tell her CEO that three-quarters of this miss came from fixable data problems and one quarter from a customer decision, and she can assign owners to each.
Seven reasons your Salesforce forecast is wrong
1. Stale close dates
- What goes wrong: Opportunities keep a close date inside the quarter long after the buyer has gone quiet, or close dates are pushed forward a month at a time without a stated reason.
- Effect: The current period is inflated, and slippage appears suddenly in the final weeks.
- What management sees: A forecast that looks stable until it collapses near quarter end.
- Diagnose: Report on open opportunities in the period with no customer activity in the last 30–60 days, and on close dates that have moved more than once. If field history tracking is enabled for Close Date, the history shows each change.
- Fix: Require a reason or next confirmed buyer step when a close date moves, and review stale deals before the forecast call rather than during it. Our earlier article on three questions to ask before you trust this quarter's number walks through a close-date review.
- Type: process weakness, made visible by data.
2. Inconsistent stage definitions
- What goes wrong: One manager's "Negotiation" means a verbal yes; another's means a first pricing call.
- Effect: In Salesforce, forecast categories are mapped from opportunity stage values, so inconsistent stages flow straight into Commit and Best Case totals (Salesforce Forecasts guide).
- What management sees: Regions with similar pipelines producing very different forecasts.
- Diagnose: Compare historical win rates by stage and by team. Large differences at the same stage usually mean different definitions.
- Fix: Write down entry criteria for each stage and enforce the important ones at the point of change. See Salesforce opportunity stage requirements for better handoffs.
- Type: process weakness.
3. Unrealistic stage probabilities
- What goes wrong: Default probabilities (for example, 75% at a late stage) are never compared with what actually closes.
- Effect: Weighted pipeline overstates expected bookings, sometimes for years.
- What management sees: A weighted forecast that is consistently higher than results: bias, as in Team A above.
- Diagnose: For the last four to six quarters, compare each stage's default probability with the share of opportunities at that stage that eventually closed won.
- Fix: Recalibrate probabilities from history, or stop using weighted totals for commitments and rely on reviewed Commit categories instead.
- Type: process weakness.
4. Duplicate opportunities and renewals
- What goes wrong: A renewal is created automatically by an integration or contract process, and a seller creates another by hand. Or a deal is cloned to change products and the original stays open.
- Effect: The same revenue is counted twice. Salesforce's standard matching rules are provided for accounts, contacts, leads and person accounts, not opportunities (Trailhead: duplicate management), so duplicate opportunities usually need their own check.
- What management sees: Renewal forecasts that never quite match the renewal schedule Finance holds.
- Diagnose: Group open opportunities in the period by account, type and close date and look for more than one record. An analyst can start with a query such as the one below (illustrative; not executed for this article):
SELECT AccountId, Type, CloseDate, COUNT(Id)
FROM Opportunity
WHERE IsClosed = false AND CloseDate = THIS_QUARTER
GROUP BY AccountId, Type, CloseDate
HAVING COUNT(Id) > 1
- Fix: Decide which process owns renewal creation, give integration-created records a stable external identifier and stop manual creation where automation already does the job. Related: Salesforce duplicate management.
- Type: technical and data defect.
5. Missing or delayed external-system updates
- What goes wrong: Orders, contract signatures or cancellations happen in another system, and the update to Salesforce fails, waits in a queue or is applied only partly.
- Effect: Opportunities stay open after they are won or lost, or close in the wrong period.
- What management sees: CRM and Finance disagree at month end, and someone fixes it by hand every time.
- Diagnose: Compare recently signed orders with their opportunities and review the integration's error log for failed or retried updates.
- Fix: Monitor integration failures, assign an owner for exceptions and resolve them before forecast snapshots are taken. See Salesforce integration error handling: what to retry, fix or escalate and the cost of manual work and missed updates in data sync.
- Type: technical defect.
6. Amounts that no longer match the signed deal
- What goes wrong: Discounts, product swaps, multi-year terms or currency changes are agreed after the opportunity amount was set, and nobody updates it.
- Effect: Forecasted value differs from booked value even when the deal closes on time, as with Cobalt Ridge in the example.
- What management sees: Small, repeated gaps that add up and are hard to trace.
- Diagnose: For closed deals, compare opportunity amount with the signed order or quote total and investigate any difference above an agreed threshold.
- Fix: Decide which system owns the final amount and synchronize it, or flag differences for review. Our article on discount approvals when deal terms change covers the approval side.
- Type: technical or process defect, depending on where the change was made.
7. Comparing bookings with invoices, cash or revenue
- What goes wrong: Sales reports bookings; Finance compares them with invoices, collections or recognized revenue.
- Effect: A multi-year contract booked in Q3 may be invoiced annually and recognized monthly, so the numbers differ by design.
- What management sees: A "forecast miss" that is really two teams measuring different things.
- Diagnose: Before investigating any variance, confirm that the forecast and the actual use the same measure, period, currency and treatment of discounts and credits.
- Fix: Agree a shared definition and a mapping between bookings and the finance measures. This is a reporting-definition issue rather than a forecasting defect, but it overlaps with accuracy whenever the agreed actual measure comes from the finance system.
- Type: reporting definition.
Three improvements to start this month
These can begin this month. Completing them may take longer, depending on how many systems and teams are involved.
| Improvement | Owner | Action | Benefit | Success measure | Complexity |
|---|---|---|---|---|---|
| 1. Establish a forecast-versus-actual baseline | RevOps with Finance | Agree the measure, snapshot date, period, formula and actual source; calculate the last four quarters | Every discussion starts from the same numbers | One agreed accuracy and bias figure per quarter, signed off by Sales and Finance | Low to medium |
| 2. Identify the most consequential data defects | RevOps or Salesforce administrator | Run the duplicate, stale-deal, amount and integration checks above on the current quarter; rank by value | Effort goes to the defects that move the number | A ranked list with dollar value and owner for each defect type | Medium |
| 3. Introduce reliable controls | Salesforce owner, integration owner, sales management | Add validation where it helps, exception reports, integration failure alerts and a named owner for each exception queue | Fewer defects reach the forecast, and less reconciliation is done by hand | Fewer open exceptions at each snapshot; less time spent reconciling before reviews | Medium to high |
If your data problems go beyond the forecast, Salesforce data quality: why it hurts your business and three ways to improve it is a useful companion.
Salesforce-to-finance reconciliation checklist
Use this checklist when the sales forecast and the finance numbers disagree. A business manager can use the left column to ask the right questions; an administrator or analyst can use the right column to build the report or query.
| Check | Question for the manager | What the analyst confirms |
|---|---|---|
| Forecast snapshot date | Which version of the forecast are we judging? | Date and time of the saved snapshot or exported report |
| Reporting period | Are both numbers for the same period? | Fiscal period definition; close date versus order or invoice date |
| Measure | Are we comparing bookings with bookings? | Forecast field (Amount or another measure) versus the finance measure |
| Opportunity ID | Can every forecast line be traced to a record? | Salesforce Opportunity ID on each snapshot row |
| Account and customer identifiers | Do Sales and Finance mean the same customer? | Account ID mapped to the finance customer number |
| Forecast amount and currency | Is the amount in the same currency and basis? | Currency code, conversion rate and date used |
| Close date | Did the deal close in the period we forecast? | Close date history; changes after the snapshot |
| Stage and forecast category | Was the deal committed when the forecast was taken? | Stage and category in the snapshot, not today's values |
| Order or invoice identifiers | Which signed order or invoice matches this opportunity? | Order or invoice number stored on, or linked to, the opportunity |
| Actual bookings or billings | What does Finance record for this deal? | Actual amount from the finance system for the same period |
| Discounts, credits and adjustments | Were terms changed after the forecast? | Differences between opportunity amount and signed amount, with reason |
| Duplicate records | Are any deals counted twice? | Grouping check by account, type and close date |
| Missing records | Is anything booked in Finance with no opportunity, or the reverse? | Unmatched orders and unmatched opportunities |
| Integration failures | Did any update fail to arrive? | Integration error log for the period, with record IDs |
| Exception owner | Who fixes each difference? | Named owner and due date for each exception |
| Reconciliation status | Is each difference explained, corrected or accepted? | Status field or column: open, explained, corrected or accepted |
Keep the snapshot. Salesforce reporting snapshots (AnalyticSnapshot metadata reference) are one way to keep historical copies of report data; a dated export works too. Without a saved snapshot, nobody can show later what the forecast actually said. Duplicate billing is a related risk covered in preventing duplicate invoices and billing errors.
When the problem is the data, not the market
No forecast will be perfect, because customers change their minds. But if your Salesforce forecast regularly disagrees with your actual results, it is worth finding out how much of the gap is customer behavior and how much is duplicate records, stale deals, mismatched amounts or failed integrations.
Logic Conduit helps teams make that split. Bring one recent quarter's forecast snapshot and the matching finance actuals, and we can help identify whether the underlying problem is your data, your reporting definitions or your system integrations, then build a practical correction plan. Tell us what you are working on to start the conversation.