Salesforce Data Quality: Why It Hurts Your Business and 3 Ways to Improve It This Month
It is Sunday evening, and the leadership meeting is at nine on Monday. Your fractional CMO opens the Salesforce pipeline report to prepare the marketing update, then opens finance's spreadsheet to check it. The numbers do not match. Some deals closed last quarter still look open. Two customers appear twice under slightly different names. A third of the opportunities have no next step at all.
Three hours later, the slides are finished, but nobody in the meeting will fully trust them.
That scene is illustrative, not a Logic Conduit client story. But if it feels familiar, you are dealing with a Salesforce data quality problem, and it is costing more than the time spent on one report.
This article explains what poor data quality does to a business, then gives you three practical improvements you can start this month without launching a large cleanup project.
Why Salesforce data quality matters to management
Salesforce is only as useful as the information people and systems put into it. When that information is incomplete, outdated or inconsistent, the damage rarely appears as a single obvious failure. It appears as a steady drain:
- Forecasts lose credibility. Open opportunities with close dates months in the past inflate the pipeline. Sales leaders start keeping a private spreadsheet "just to be sure."
- Marketing cannot prove its contribution. If campaign, lead source or account data is inconsistent, attribution reports become arguments rather than evidence.
- Duplicate customers create confusion. Two account records for one customer can mean two sellers calling the same buyer, split activity history and revenue reported in the wrong place.
- Executives make decisions on different versions of the truth. When sales, finance and marketing each define "pipeline" or "active customer" differently, every meeting starts with reconciling numbers.
- Integrations repeat the problem. A marketing platform, billing system or website form can keep creating or overwriting records, so yesterday's cleanup is undone by tomorrow's sync.
An illustrative cost calculation
Here is a simple way to estimate the recurring management cost. The figures are assumptions for illustration; replace them with your own.
| Assumption | Example value |
|---|---|
| Managers who reconcile or correct Salesforce data before meetings | 4 |
| Hours each spends per week | 3 |
| Working weeks per year | 48 |
| Fully loaded cost per management hour | $100 |
4 managers × 3 hours × 48 weeks = 576 hours per year, or roughly $57,600 of management time spent checking numbers instead of acting on them.
That figure excludes harder-to-measure costs: a missed renewal, a campaign cut because its results could not be shown, or a hiring decision made on an inflated pipeline. You do not need a precise number to see that the problem deserves an owner.
Three practical improvements to make this month
The goal for the next four weeks is not "perfect data." It is reliable data in the places that drive your most important decisions.
Improvement 1: Find the data errors that matter most (week 1)
Most organizations try to clean everything and stall. Start instead with one report your leadership team actually uses, such as the open pipeline report reviewed every Monday.
Ask three questions about it:
- Which fields does this report depend on? (For a pipeline report: Stage, Amount, Close Date, Owner and often Next Step.)
- Which of those fields are blank, out of date or inconsistent?
- How much of the reported value sits on records with those problems?
We built a small synthetic example in a Salesforce Developer Edition test org to show what this looks like. The fictional customer, Larkspur Freight Co., has six open opportunities worth $132,000 in total.
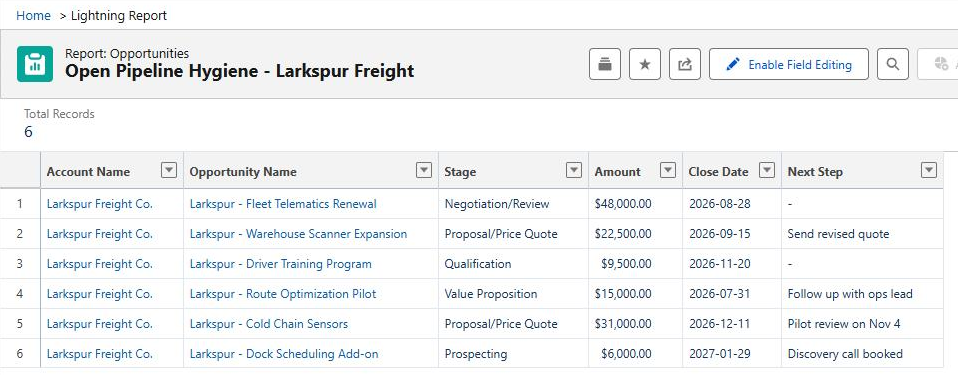
On the report date of October 21, 2026, a quick review shows:
- 3 of 6 open opportunities have a close date in the past (August 28, September 15 and July 31). Together they represent $85,500, about 65% of this account's open pipeline.
- 2 of 6 have no Next Step, including the largest deal.
- 4 of 6 have at least one of these problems.
Nothing here requires advanced tools. It is a standard Opportunities report with four columns and two filters. But it turns a vague complaint ("the pipeline feels wrong") into a specific, fixable list.
What the same report looks like after a short cleanup
Next, we corrected the four problem records the way a sales manager would ask the account owner to:
- Fleet Telematics Renewal ($48,000): the close date moved to a realistic date in late November, and a concrete next step was added ("Confirm legal review date with buyer").
- Warehouse Scanner Expansion ($22,500): the past-due close date was updated to mid-November.
- Driver Training Program ($9,500): a next step was added ("Schedule needs review with HR lead").
- Route Optimization Pilot ($15,000): the pilot had not moved since July, so it was closed as lost rather than left in the forecast.
Then we reran the same report, with the same filters and columns.
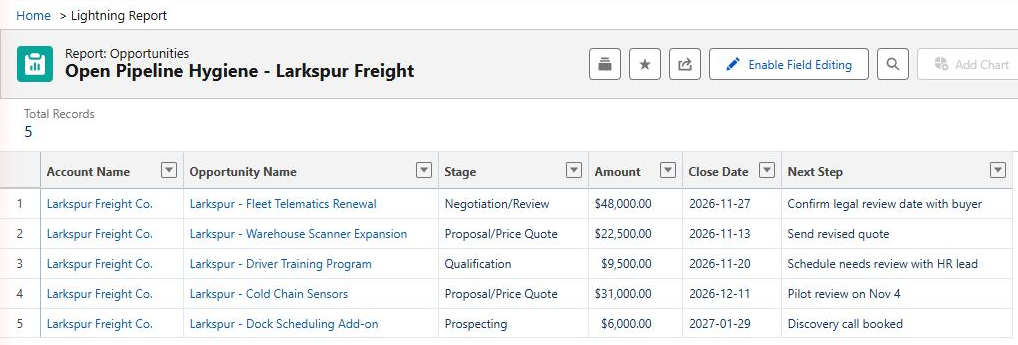
You do not need to read every row to see the difference. Every remaining deal now has a future close date and a written next step, so a manager can ask a useful question about each one ("Did legal confirm the review date?") instead of first asking whether the deal is still real.
The total open pipeline for this account fell from $132,000 to $117,000. That is not a loss; the $15,000 pilot was already stalled. The smaller number is simply one leadership can believe.
One caution matters here. In this demonstration we set the new dates ourselves. In a real business, the new close dates must come from a conversation with the buyer, not from pushing old dates forward a month. Otherwise the report looks clean while the forecast stays just as wrong.
First-week action: Pick one leadership report. Add the fields it depends on as columns, filter to open records and count how many records, and how much value, have missing or outdated information. Ask each deal owner to confirm or correct their flagged records by the end of the week.
Measurable result: A baseline, such as "65% of open pipeline value carries a past-due close date," and a first correction pass you can compare against it.
Improvement 2: Prevent the errors from coming back (week 2)
Correcting records is necessary, but if the same process keeps producing bad data, the cleanup will not last. Prevention is where most lasting improvement comes from.
Salesforce offers several native controls:
- Validation rules check that data meets a standard before a record is saved and show the user an error message when it does not. For example, you might require a Next Step before an opportunity moves into a late stage. (Trailhead: Create Validation Rules)
- Matching rules and duplicate rules identify likely duplicate Accounts, Contacts and Leads and either warn the user or block the save. (Trailhead: Resolve and Prevent Duplicate Data in Salesforce)
- Clear ownership so that every important field has a person or team responsible for keeping it current.
- Integration field mappings reviewed so connected systems do not overwrite good Salesforce data with incomplete values.
Each control needs careful design. A validation rule that is too broad can stop sellers from saving legitimate updates, or cause an integration to fail silently. In our own test org, an existing validation rule that requires a "Primary Pain Point" on opportunities rejected our first attempt to load the sample records. That is exactly what a good rule should do, but it is also a reminder: any new control must be tested against every route that creates or updates records, including imports and integrations, not just the screen sellers use. Duplicate rules carry similar tradeoffs; an overly aggressive rule frustrates users, while a rule that only warns may be routinely clicked past.
For a deeper look at duplicates specifically, see our guide to Salesforce duplicate management. If your pipeline problems come from missing information at stage changes, Salesforce opportunity stage requirements covers that in detail.
Second-week action: For the top one or two problems found in week one, identify where the bad data comes from (a person, a form, an import or an integration) and choose one targeted control. Test it in a sandbox before switching it on.
Measurable result: New records created after the control goes live no longer show the defect.
Improvement 3: Make data quality measurable and owned (weeks 3 and 4)
Data quality improves when someone can see it and is responsible for it. A lightweight scorecard is usually enough.
Week three: build the scorecard. Turn the week-one review into a saved report or small dashboard with a few measures, for example:
- Open opportunities with a close date in the past (count and value)
- Open opportunities with no Next Step
- New Accounts or Contacts flagged as possible duplicates this week
Keep the definitions fixed so the trend means something. If "past-due" means "close date before today, stage not closed," write that down and do not change it mid-month.
Week four: assign owners and a rhythm. Each sales manager reviews their team's exceptions weekly. RevOps or a Salesforce administrator owns the scorecard and the controls. Leadership looks at the trend monthly.
Here is what that scorecard looks like for the Larkspur Freight example, using the two reports shown above. This is the level of detail most executives need: three or four numbers and the direction they are moving.
| Pipeline health measure (Larkspur Freight Co.) | Before | After |
|---|---|---|
| Open opportunities | 6 | 5 |
| Open pipeline value | $132,000 | $117,000 |
| Deals with a close date already in the past | 3 ($85,500) | 0 ($0) |
| Share of pipeline value with a past-due close date | 65% | 0% |
| Deals with no next step recorded | 2 | 0 |
| Deals needing attention before the forecast meeting | 4 of 6 | 0 of 5 |
Cleaner inputs are not proof that the forecast itself became more accurate, and in a real organization the "after" column will rarely reach zero and stay there. New deals age, buyers go quiet and integrations introduce new records every day. The point of the scorecard is to make those exceptions visible early and to show whether the prevention steps from week two are working.
Measurable result: A falling number of exceptions week over week, and fewer hours spent reconciling reports before leadership meetings.
When the problem requires outside help
Some data quality problems can be handled internally with the steps above. Others have causes that are harder to see. Consider outside help when:
- Multiple integrated systems disagree about the same customer, deal or invoice, and nobody knows which one is right.
- Errors return after cleanup, which usually means a process, automation or integration is still creating them.
- Salesforce configuration or automation is introducing problems, such as flows or triggers overwriting values. (See Salesforce integration error handling for related failure patterns.)
- No one can name the authoritative source for key information such as customer status or contract value.
- Executive reporting is still unreliable despite repeated manual fixes.
A sensible first step is a bounded diagnostic rather than a large project. A diagnostic typically traces how records are created and updated for one important process, identifies where errors enter, checks existing validation, duplicate and integration settings, and recommends a small set of proportionate fixes in priority order. It will not make every field perfect, and it should not promise a specific revenue outcome. It should tell you why your numbers are wrong and what will stop them going wrong again.
Start with the report you trust least
Poor Salesforce data quality is rarely caused by careless people. More often, it is the result of reasonable shortcuts, past migrations and connected systems that were never designed to work together. The fix starts with one important report, one baseline and one owner.
If your team spends too much time reconciling Salesforce reports, or cleanups keep coming undone, contact Logic Conduit. Bring one report leadership does not trust and a short description of where its data comes from. We can help you trace the data flow, find what is causing the recurring errors and agree on proportionate improvements.