Salesforce Too Many SOQL Queries 101: How to Fix the Error — and Find the Bigger Problem
An import stalls. A record save fails. An integration job starts throwing rows back. Somewhere in the message is this:
System.LimitException: Too many SOQL queries: 101
The failing transaction is rolled back entirely, so nothing from it is saved. That is the good news and the bad news at once: your data is consistent, and your process is stopped.
What Does "Too Many SOQL Queries: 101" Mean?
Salesforce runs many customers on shared infrastructure, so it caps what any single transaction can consume. These caps are the governor limits. One of them is the number of SOQL queries a transaction may issue.
In synchronous Apex — triggers, controllers, validation paths, anything running in the user's save — that cap is 100 queries. In asynchronous Apex — Batch, Queueable, @future, Scheduled — it is 200, which is why the asynchronous version of this error reads Too many SOQL queries: 201.
The 101 is not an error code. It is the number of the query that was refused. You asked for the 101st; there were only 100.
You can read the limit from inside your own org. Running this in the Developer Console's Execute Anonymous window reports the current count and the ceiling:
System.debug('QUERIES=' + Limits.getQueries() + ' of ' + Limits.getLimitQueries());
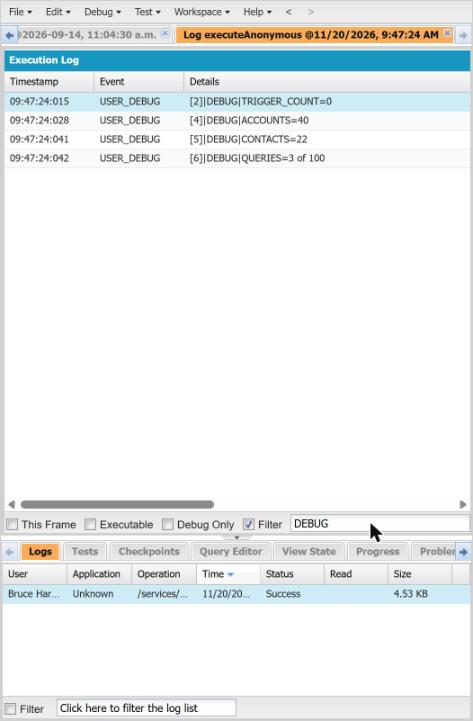
Baseline reading from the test org used for this article. The script itself had already consumed 3 of the 100 synchronous queries. Confirming the org had zero existing Apex triggers meant the demonstration below could not be contaminated by unrelated automation.
The most important word in that limit is transaction. The budget is not per trigger, per Flow, or per class. Everything that runs inside one save shares the same counter: your trigger, every record-triggered Flow on that object, every managed package subscribing to it, and anything those components cause in turn. A component that behaves perfectly on its own can still be the one that asks for query 101.
How to Find What's Consuming Your SOQL Queries
Work from the transaction, not from the component named in the error. The named component is where the budget ran out, not necessarily where it was spent.
- Identify the failing operation precisely. Which object, which action (insert, update, delete), and how many records at once. Volume is usually the variable that changed.
- Turn on a debug log for the user who hits it. In Setup, under Debug Logs, add a trace flag for that user with a log level that sets Database to FINEST. Then reproduce the failure.
- Open the log and filter it. In the Developer Console, open the log and filter on
SOQL_EXECUTE_BEGIN. You get one line per query, each showing the originating line and the query text. Repetition of the same query text is the signal you want. - Read the LIMIT_USAGE_FOR_NS section at the end of the log. It breaks consumption down by namespace, which separates your code from a managed package's.
- Instrument the suspect path. Drop
System.debug(Limits.getQueries())at the entry and exit of each handler. The one where the number jumps by roughly the record count is your culprit.
Repetition of one query text, scaling with the number of records, means a query is running inside a loop.
Worked Example: Fixing an Apex Trigger That Queries Inside a Loop
Here is the pattern, reproduced and then corrected in a real Developer Edition org. Every number below came out of the debug log of an actual run.
The business rule: when an Account is created, rate it Hot if we already have at least three Contacts in the same city, otherwise Warm. Reasonable, and harmless in a single-record test.
The failing code
trigger AccountContactRatingTrigger on Account (before insert) {
    for (Account acc : Trigger.new) {
        // One SOQL query per record. Fine for 1 record, fatal for 150.
        Integer nearby = [SELECT COUNT() FROM Contact
                          WHERE MailingCity = :acc.BillingCity];
        acc.Rating = (nearby >= 3) ? 'Hot' : 'Warm';
    }
}
A trigger does not fire once per record. It fires once per batch, with up to 200 records in Trigger.new. The loop therefore issues one query per record in the batch. At 150 records, the 101st query is refused.
The actual failure
Inserting 150 Accounts in one transaction against that trigger:
List<Account> accts = new List<Account>();
for (Integer i = 0; i < 150; i++) {
    accts.add(new Account(Name = 'SOQL101 Demo ' + i, BillingCity = 'Toronto'));
}
insert accts;
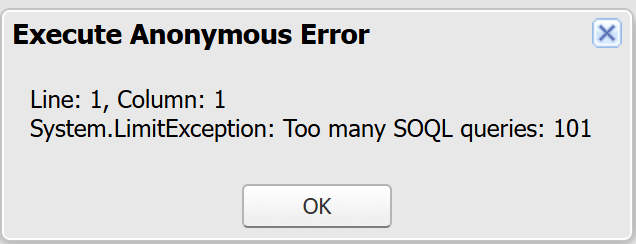
The real exception, thrown by the trigger above on a 150-record insert. The whole transaction was rolled back; none of the 150 Accounts were created.
Note what the loop actually costs. It is not that 150 is close to 100. It is that query count is tied to record count, so the code works in every test anyone ran by hand and fails the first time a real batch arrives.
The corrected code
Bulkification means collecting the inputs first, querying once for all of them, and then applying the result record by record — the pattern Salesforce's own guidance on running within governor limits recommends:
trigger AccountContactRatingTrigger on Account (before insert) {

    // 1. Collect every city in this batch.
    Set<String> cities = new Set<String>();
    for (Account acc : Trigger.new) {
        if (acc.BillingCity != null) { cities.add(acc.BillingCity); }
    }

    // 2. One aggregate query for the whole batch, whatever its size.
    Map<String, Integer> countsByCity = new Map<String, Integer>();
    for (AggregateResult ar : [SELECT MailingCity city, COUNT(Id) total
                               FROM Contact
                               WHERE MailingCity IN :cities
                               GROUP BY MailingCity]) {
        countsByCity.put((String) ar.get('city'), (Integer) ar.get('total'));
    }

    // 3. Apply the same business rule from memory, not from the database.
    for (Account acc : Trigger.new) {
        Integer nearby = countsByCity.containsKey(acc.BillingCity)
                       ? countsByCity.get(acc.BillingCity) : 0;
        acc.Rating = (nearby >= 3) ? 'Hot' : 'Warm';
    }
}
The query count is now fixed at one, whether the batch holds 1 record or 200.
Before and after, measured
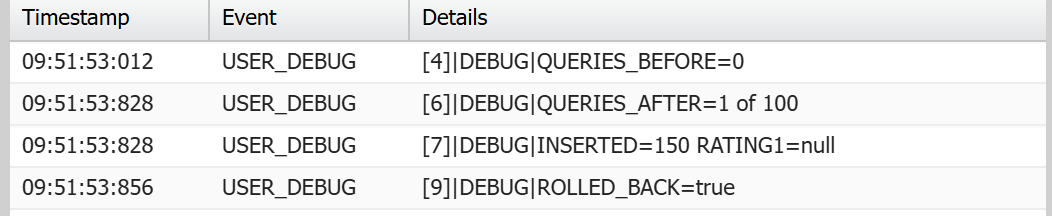
The same 150-record insert against the corrected trigger. Query consumption went from refused-at-101 to a measured 1 of 100. The test harness rolled its own transaction back so the org was left unchanged.
| Run | Records | SOQL used | Result |
|---|---|---|---|
| Query inside the loop | 150 | Refused at 101 | System.LimitException, full rollback |
| Bulkified, one aggregate query | 150 | 1 of 100 | Insert succeeded |
Validating the fix properly
A lower query count is not by itself a passing grade. The fix has to still produce the right answer. Reducing queries by quietly breaking the business rule is not a fix — it is a slower-burning bug.
So the corrected trigger was re-run against a batch built to split the rule: three Contacts seeded in one city, then 150 Accounts alternating between that city and a city with no Contacts at all. The rule says the first group should come out Hot and the second Warm.
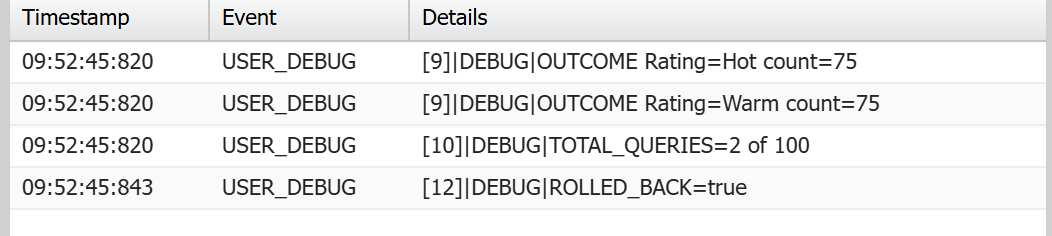
Business outcome confirmed, not just the limit: 75 Accounts rated Hot and 75 rated Warm, exactly as the rule requires, using 2 of 100 queries in total — one inside the trigger, one for this verification read.
These are different kinds of evidence and worth keeping separate in your own testing: that the code compiles, that it runs without exceptions, that it consumes fewer queries, and that it still produces the correct business result. The fourth is the one teams skip.
Write this as an Apex test that inserts 200 records — the full trigger batch size — and asserts both things. A bulk test is the only thing that stops this bug from coming back the next time someone edits the handler.
@isTest
private class AccountContactRatingTriggerTest {

    @isTest
    static void bulkInsertStaysWithinSoqlLimit() {
        // Three Contacts in one city; none in the other.
        List<Contact> seed = new List<Contact>();
        for (Integer i = 0; i < 3; i++) {
            seed.add(new Contact(LastName = 'Seed ' + i, MailingCity = 'Barrie'));
        }
        insert seed;

        // A full trigger batch: 200 records, half in each city.
        List<Account> accts = new List<Account>();
        for (Integer i = 0; i < 200; i++) {
            accts.add(new Account(Name = 'Bulk ' + i,
                BillingCity = (Math.mod(i, 2) == 0) ? 'Barrie' : 'Nowhereville'));
        }

        Test.startTest();
        Integer before = Limits.getQueries();
        insert accts;
        Integer used = Limits.getQueries() - before;
        Test.stopTest();

        // 1. The limit assertion: this is what stops the bug coming back.
        System.assertEquals(1, used,
            'Trigger must issue exactly one SOQL query for the whole batch');

        // 2. The outcome assertions: a cheap wrong answer is still wrong.
        System.assertEquals(100, [SELECT COUNT() FROM Account
            WHERE Rating = 'Hot' AND Id IN :accts],
            'Accounts in a city with 3+ contacts should be Hot');
        System.assertEquals(100, [SELECT COUNT() FROM Account
            WHERE Rating = 'Warm' AND Id IN :accts],
            'Accounts in a city with no contacts should be Warm');
    }
}
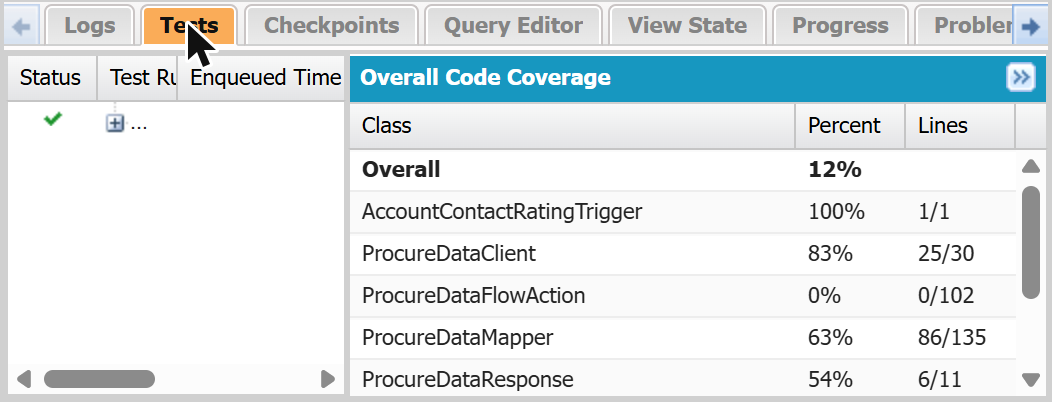
The bulk test passing against the corrected trigger at the full 200-record batch size, with the trigger at 100% coverage. Run against the failing version, the same test throws Too many SOQL queries: 101 instead.
What If the Apex Trigger Isn't the Only Problem?
You fixed the trigger and the transaction now uses 1 query. It can still fail, because the budget was never yours alone.
Other things spending from the same counter during that save:
- Record-triggered Flows on the same object. Get Records elements consume queries from the same transaction budget, and a Get Records inside a loop is the Flow-shaped version of exactly the bug above — which is often how an unhandled fault in a Flow starts.
- Cascading automation. Your trigger updates a related record; that record's own triggers and Flows run inside the same transaction and spend from the same 100.
- Re-entrancy. Automation that updates the object it fires on can run its handlers more than once in a transaction if nothing guards against it.
- Managed packages. Here the detail matters: code in a managed package with its own namespace generally gets its own limit allocation rather than drawing down yours, which is why some of these errors carry a namespace prefix such as
SBQQ:. Check the specific package's behaviour and your log's LIMIT_USAGE_FOR_NS section rather than assuming either way.
Two fixes that aren't fixes
Moving the work to asynchronous Apex raises the ceiling from 100 to 200. It does not make a per-record query stop being a per-record query. At 201 records you are back where you started, now with a failure the user cannot see — and queries are not the only budget you are spending, as anyone who has met Apex CPU time limit exceeded will recognise.
Adding fault handling catches the exception; it does not reduce consumption. The transaction still rolls back. You have traded a visible error for a silent one.
Why Fixing One SOQL 101 Error May Not Solve the Underlying Problem
A targeted repair answers one question: is this component efficient? Automation health answers a different one: can everything that runs in this transaction coexist at the volumes the business actually produces?
The common shape looks like this. An org grows. A trigger is added for one rule, a Flow for another, a package for a third, each built and tested with one record at a time, each correct on its own. Nobody owns the transaction as a whole, because no one component is the transaction. Then data volume rises — a migration, a new integration, a bigger import — and the shared budget is spent before the last component gets its turn.
That is why the component named in the error is often not the one at fault. It is simply the one that asked last. This is Salesforce technical debt in its most literal form: each decision was defensible, and the interest is paid by whoever is on call the day volume changes.
The Hidden Business Costs of Fragile Salesforce Automation
The technical failure is cheap. What it causes is not:
- Imports that cannot complete, so a migration slips because the automation was not ready for it and the team keeps running on the old system.
- Integration jobs that need manual intervention each run, quietly becoming someone's unofficial job — usually a sign the integration error handling is reporting symptoms rather than causes.
- Sales processes interrupted mid-save, eroding trust in the CRM itself — users route around what they do not trust.
- Troubleshooting effort that cannot be planned, because nobody knows which incident is one line of code and which is three weeks of untangling.
- Releases with downstream effects nobody predicted, because no dependency map exists.
None of this shows up as a line item. It shows up as a team that has stopped trusting its own release process.
When Is a Targeted Fix Enough — and When Do You Need an Automation Review?
A targeted fix is probably enough when:
- The defect is isolated and reproducible on demand.
- One team clearly owns the component.
- Few other components run in the same transaction.
- A 200-record bulk test passes on both outcome and query count.
- The error has not appeared in other processes.
A broader review is worth considering when:
- Several components draw on the same transaction budget.
- The same class of error recurs across different business processes.
- Imports and integrations fail at volume but pass in testing.
- No dependency map exists and no one can name everything that runs on save.
- Fixes keep causing new incidents elsewhere.
A review of this kind is not a rewrite. It maps what actually executes in your highest-risk transactions, measures what each part consumes, finds duplicated and redundant logic, and puts the remediation in priority order — so you can decide what to fix now, what to consolidate later, and what to leave alone. That is the shape of our Salesforce integration remediation work, and for teams who would rather not carry this in-house, of ongoing managed services.
Fix the Error. Then Make Salesforce More Reliable.
Fixing the query that caused today's failure is worth doing, and it is often all that is needed. But if SOQL limits, Flow faults and CPU exceptions keep returning in different places, the issue is usually not any single component — it is how your automations interact inside one transaction.
Contact Logic Conduit for a free assessment of your Salesforce challenges. Send us the error and what you were doing when it appeared. We will look at it and tell you straight whether it is a one-line fix you can make yourself or a sign of something bigger — no charge, no obligation, and no pitch if the answer is the former.
Get your free Salesforce assessment →
Related reading
- Salesforce Apex CPU Time Limit Exceeded — the other limit that surfaces when too much runs in one transaction. Different limit, related cause.
- An Unhandled Fault Has Occurred in This Flow — how the same transaction pressure shows up on the Flow side.
- Salesforce FIELD_CUSTOM_VALIDATION_EXCEPTION — diagnosing a save that fails for a different reason.
- Salesforce technical debt — what accumulates when each fix is local.
- Salesforce integration remediation — how we approach this work.