Salesforce Apex CPU Time Limit Exceeded: How to Find the Cause and Fix It
It is the first week of the fiscal year. An administrator opens a prepared file of new tier pricing, starts the import, and comes back to a column of red:
System.LimitException: Apex CPU time limit exceeded
Nothing obvious changed. The same update worked on a single record ten minutes ago. It worked in the sandbox. And the component named in the error is often something nobody on the team wrote.
The message means something narrow: Salesforce spent the processing budget for that transaction before the work finished, so it stopped and rolled everything back. What it does not tell you is which automation spent the budget — and the obvious suspect is frequently innocent. Fixing the wrong thing is how teams end up doing this twice.
What the Apex CPU time limit actually measures
Salesforce gives each transaction a fixed allowance of application-server processing time:
| Context | CPU allowance |
|---|---|
| Synchronous (UI saves, Apex web services, executeAnonymous) | 10,000 ms |
| Asynchronous (Batch, Queueable, future, scheduled) | 60,000 ms |
| Bulk API and Bulk API 2.0 | separate limit, capped at 60,000 ms |
Three properties of that allowance cause most of the confusion.
It is CPU time, not wall-clock time. The per-transaction governor limits documentation excludes database execution time for DML, SOQL and SOSL, time spent waiting on a callout, and Apex compilation. A slow query can make a save feel sluggish without moving this number at all. A transaction that finishes quickly can still be burning CPU hard.
It is one budget for the whole transaction. Apex triggers, record-triggered flows, legacy workflow rules, validation-rule formulas and managed-package code all draw from the same pot, regardless of how many certified packages are involved — a point Salesforce repeats in its guidance on coding more efficiently. Add a flow to an object that already has triggers and you have not been given a second allowance; you have taken a slice of the existing one.
It is spent in an order you did not choose. Before-save flows, after-save flows and Apex triggers execute at defined points in the order of execution, and whatever runs last inherits whatever is left.
That third point is where diagnosis usually goes wrong.
Why the component named in the error is usually not the culprit
Read the error from a failed import and you will typically see a namespace and a trigger name. It is tempting to treat that as the answer. It usually is not.
Salesforce says so in its own knowledge base. Its article on Account Engagement sync failures describes this error as almost always a "team effort" of several triggers running together, and notes that Account Engagement may simply be the process that happened to be running when the budget ran out — so its trigger gets named even though other automation consumed most of the time.
The more striking evidence is how many independent vendors have had to publish the same article. LeanData, Plauti, Vicasso, Conga, Gainsight and MoveData all maintain support pages explaining that an error naming their package is a shared-budget problem, not a defect in their code. LeanData calls these timeouts a "group effort" and notes that whichever package is executing when the limit is crossed gets named, regardless of how little of the budget it used.
When six vendors independently write the same support article, the pattern is not an edge case. It is the normal failure mode.
Practitioner reports show the same shape. In one Salesforce Stack Exchange thread, an administrator rolling out annual tier pricing hit this error during an Account update that cascaded into Opportunity updates — and the trigger named belonged to the Nonprofit Success Pack, not to anything she had built. In another, a flow walking an Account hierarchy failed above four or five records, naming a managed-package trigger reached indirectly through the author's own flow. A third described an integration whose failures surfaced from a different component on almost every run, the only constant being the Account object.
Note what those cases share beyond the error text: none ended with a confirmed fix in the thread. The first author abandoned the automation and wrote Data Loader instructions instead. That is worth remembering before copying a remedy from a forum.
How to find what is actually consuming CPU time
The goal is attribution, not a list of suspects.
- Pin down the operation. Which user, which object, which record, and was it a single save, a list import, an integration write or a scheduled job? The allowance differs across synchronous, asynchronous and Bulk API contexts, so this changes what "normal" looks like.
- Establish whether volume is the trigger. If one record saves and two hundred fail, you have a per-record cost problem, not a broken component.
- Turn on debug logging for the affected user. Salesforce's CPU troubleshooting guidance suggests Apex Code at FINER or FINEST, Apex Profiling at FINEST, System at DEBUG, and Database, Workflow, Validation and Callout at INFO.
- Reproduce at the smallest volume that still fails. This matters more than it sounds — see the warning below.
- Read the log for cumulative totals, not single events.
LIMIT_USAGE_FOR_NSandCUMULATIVE_PROFILINGshow where the budget went. For flows, Salesforce's Flow CPU page points toFLOW_ELEMENT_LIMIT_USAGEfor per-element consumption andCUMULATIVE_LIMIT_USAGEfor the running total. - Use the Developer Console's Analysis perspective. Open Executed Units and compare Total Time against Self Time. High self time points at an expensive loop or calculation; high total time with low self time points at something downstream.
- Form one hypothesis and test only that. Change a single thing, re-measure, keep the log. The same discipline applies to other platform failures — it is how we approach record-locking errors too.
A warning about log size. Salesforce caps a single debug log at 20 MB and truncates from the end — exactly where the cumulative summary sits. This is not theoretical. Running a two-thousand-record comparison in a Developer Edition org for this article produced a 17.86 MB log from one anonymous Apex block, and a second, smaller run produced 18.31 MB. Both came within roughly ten percent of destroying the evidence they were collecting.

Figure 1. One anonymous Apex block over 2,000 records produced a 17.86 MB debug log at verbose levels, against Salesforce's 20 MB cap.
What the numbers actually look like
To put figures against this, I ran a measured comparison in a Developer Edition org using Limits.getCpuTime(). The scenario was an annual price-tier rollout: match renewal records to accounts by an ERP reference, in memory, with no DML. Two implementations, identical results, different lookup strategy.
Integer startCpu = Limits.getCpuTime();

// The operation being measured goes here.

Integer elapsedCpu = Limits.getCpuTime() - startCpu;
System.debug(LoggingLevel.WARN, 'CPU delta (ms): ' + elapsedCpu);
System.debug(LoggingLevel.WARN, 'Total CPU (ms): ' + Limits.getCpuTime());
System.debug(LoggingLevel.WARN, 'CPU limit (ms): ' + Limits.getLimitCpuTime());
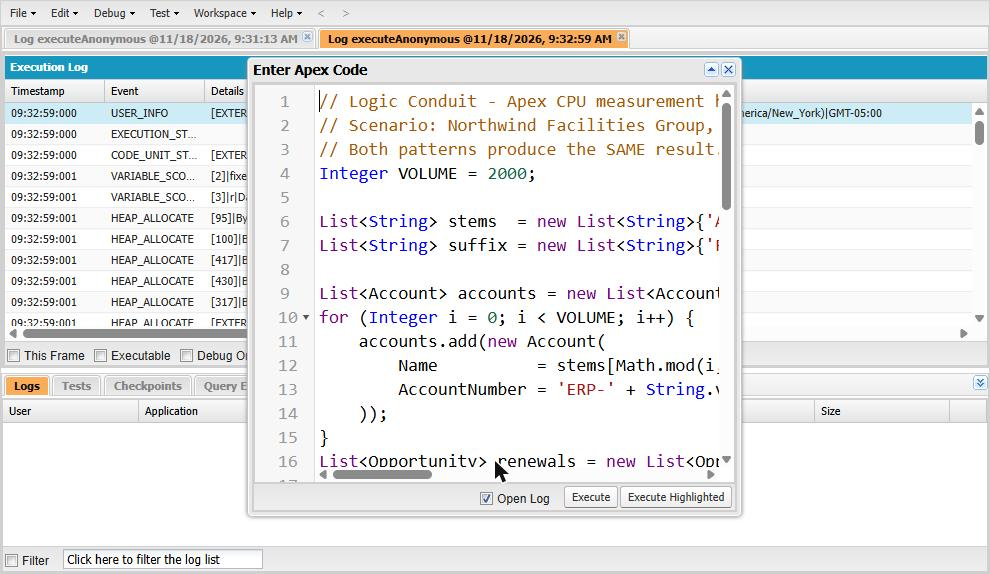
Figure 2. The measurement harness in Execute Anonymous. Both strategies run in the same transaction against the same records, so the only variable is how the match is performed.
The nested-loop version searched the whole account list for every renewal — the shape a Loop element inside another Loop element produces:
for (Opportunity o : renewals) {
    for (Account a : accounts) {
        if (a.AccountNumber == o.Description) { matched++; break; }
    }
}
The corrected version builds the index once, then makes a single pass:
Map<String, Account> accountByErp = new Map<String, Account>();
for (Account a : accounts) {
    accountByErp.put(a.AccountNumber, a);
}
for (Opportunity o : renewals) {
    if (accountByErp.containsKey(o.Description)) { matched++; }
}
| Records | Nested loop | Map lookup | Share of the 10,000 ms budget (nested) |
|---|---|---|---|
| 100 | 33 ms | 2 ms | 0.3% |
| 200 | 120 ms | 2 ms | 1.2% |
| 400 | 489 ms | 5 ms | 4.9% |
| 800 | 1,913 ms | 8 ms | 19.1% |
| 2,000 | 11,706 ms | 23 ms | 117% |
Rows up to 800 records come from one execution; the 2,000-record row was measured in a separate execution of the same two patterns.
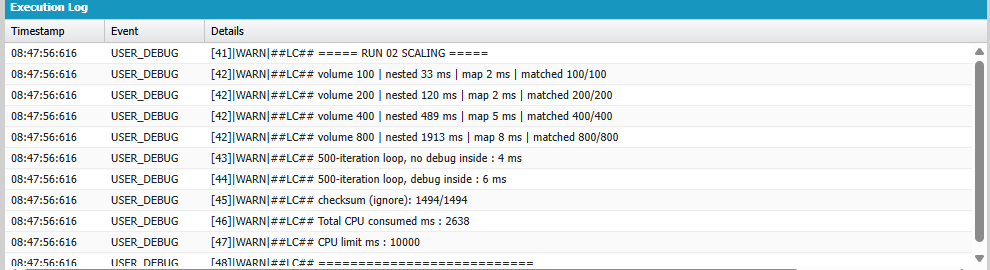
Figure 3. Execution log output from the Developer Edition org. The nested-loop column roughly quadruples with each doubling of volume; the map column stays close to flat.
Both versions returned identical results at every volume. The difference is entirely cost.
The important column is the last one. At one hundred records this code is invisible. At two hundred — one standard trigger batch — it still looks harmless. At two thousand it consumes more than the entire budget on its own, before any other automation has run. Each doubling multiplied the cost by roughly four, the signature of work that grows with the square of the record count. Extrapolating from the 800-record measurement predicts 11,956 ms at 2,000; the separately measured figure was 11,706 ms.
That is why a passing single-record test proves so little, and why the sandbox that works can still be the org that fails.
Two honest caveats. These runs used verbose debug levels, so the absolute milliseconds include logging overhead and should be read as upper bounds; the ratios and the shape of the curve are the durable findings. And the test isolates one inefficient pattern — it does not reproduce a crowded multi-automation transaction, which the documentation and practitioner cases above speak to instead.
Five patterns that produce this error
- Repeated work inside loops. Queries, DML and recalculation per iteration. Salesforce's flow guidance is specific: a Get Records element inside a loop runs one query per iteration, and creating a task for each of a hundred opportunities means a hundred separate DML operations.
- Record updates that trigger further record updates. An Account update fires automation that updates Contacts and Opportunities, each with automation of its own. Salesforce's architect guidance treats five or more downstream DML operations as high dependency sprawl, with real risk of recursion.
- Bulk imports meeting automation that was never bulkified. Record-triggered flows receive batches. A flow doing per-record lookups passes a manual test and fails a two-hundred-record import. The table above shows why.
- Layers of automation accumulated over years. Workflow rules, old processes, flows and triggers coexisting on one object, each added by someone solving a reasonable problem, none aware of the others.
- Managed-package and integration automation in the same transaction. Package code counts against the same budget and is not yours to optimise. Salesforce's proactive monitoring guidance routes these to the package author.
Fixing it without breaking something else
- Remove repeated work first. Move queries out of loops, build a Map once, use aggregate SOQL so the database does the arithmetic. Usually the cheapest meaningful win, and the table above shows its size.
- Process in collections. In Flow, build a collection inside the loop and perform one Create, Update or Delete afterwards. Transform elements handle filtering and mapping more efficiently than loops.
- Make automation stop early. Entry criteria and prior-value comparisons keep logic from running on saves that do not concern it.
- Consolidate entry points. Salesforce recommends one primary automation entry point per object, because execution order across multiple triggers on the same object and event is not guaranteed.
- Consider asynchronous processing carefully. Queueable or Batch Apex raises the ceiling to 60 seconds, but it is a design change, not a setting. The asynchronous path in a record-triggered flow shares daily asynchronous limits and is not intended for very high volume, and Salesforce's architect guidance calls invoking Batch or Schedulable Apex from a trigger an anti-pattern. Eventual consistency, error recovery and sequencing all become your problem.
- Test at realistic transaction sizes, in a managed sandbox, before anyone trusts the fix.
Two things worth stating plainly, because both appear in search results regularly. The CPU limit is fixed and cannot be raised. And a try/catch around the failing operation is not a fix: by the time the exception is raised the budget has already been spent, so suppressing the message only hides a transaction that still cannot complete.
When a CPU error signals something larger
For an isolated defect — one loop, one object, one recently shipped flow — a targeted fix is the right answer.
The picture changes when failures move around. Salesforce's record-triggered automation decision guide uses the idea of automation density: the load on a specific object, measured across how many automations exist, how many records they process, and how far changes cascade. It places over thirty automations on an object, bulk loads in the thousands, and five or more downstream DML operations in the high-density band — and recommends genuinely different architecture at that level, not a tuned flow.
Density is why the practitioner cases above are more alarming than they first look. One of those flows failed above four or five records. Low volume is no protection when the transaction is already crowded. It is also how accumulated technical debt stops being an abstraction and starts failing saves.
What recurring failures cost the business
These are illustrative scenarios, not measured outcomes, and the cost in any org depends on what the failing transaction supports.
Operations that cannot complete. A pricing rollout or territory change that stops partway leaves records in a mixed state. The transaction rolls back, but the operation does not — work committed in earlier batches stays committed.
Integrations that need reconciliation. Inbound writes from marketing or ERP systems fail intermittently, and someone has to work out which records landed. Error handling and retry design becomes the difference between a logged retry and a manual spreadsheet.
Repeated investigation without resolution. Each incident consumes technical time, and because the error names a different component each time, each investigation starts over.
Change risk. When nobody can say what executes during a record save, every release carries unquantified regression risk.
What is worth measuring is not a headline loss figure but something concrete: how often this happens, which operations it blocks, and who reconciles afterwards.
Repair one trigger, or review the architecture?
A targeted repair fits when the root cause is isolated, the automation has few dependencies, regression testing is straightforward, and the fix produces a measurable improvement you can show in a log.
An architecture review earns its cost when several processes fail on the same object, automation spans multiple teams or packages, imports and integrations fail unpredictably, fixes keep causing regressions elsewhere, or — the most reliable signal — nobody can clearly explain what executes when a record is saved.
A review of that kind should produce an automation inventory for the affected objects, a dependency map of what triggers what, profiling evidence showing where the budget actually goes, risk-ranked recommendations, and a remediation plan with a defined finish line. The point is to decide on evidence rather than on which component the error happened to name.
Make the next critical update survive
A CPU limit error is a reliability problem before it is a code problem. The transaction that fails is a price change, a territory realignment or an inbound order — work the business expected to be finished.
Dealing with recurring Salesforce CPU limit errors? Logic Conduit can help investigate the affected transactions, identify which automation is actually consuming the budget, and determine whether a targeted fix or broader remediation is warranted.