Salesforce Report Examples: 6 Reports Sales Managers Should Question
Your Salesforce dashboard shows a healthy pipeline. Before you approve more hiring, raise activity targets or commit to a revenue number, ask: which deals are moving, which customer conversations are missing, and does Finance agree?
A Salesforce report can be accurate and still lead management to the wrong decision. These six Salesforce report examples show sales leaders, RevOps teams and finance managers what to question before acting—and where reporting, workflow or integration changes may help.
The examples use synthetic Salesforce records and separate comparison figures. The pipeline screenshots show report results; the activity and order comparisons illustrate missing business context rather than live integrations.
Data, information and judgment
Separate three layers in a pipeline review:
- Data: what has been recorded in Salesforce, by people, automation and integrations.
- Information: what a report calculates or summarizes from those records, given its filters, report type and the access of the person running it.
- Judgment: what management is justified in concluding, and what action should follow.
A report need not answer every management question. Problems start when its calculations are treated as proof of a business outcome. Administrators, analysts and sales leaders each hold context the others need.
1. The healthy pipeline that isn't progressing
Management question: Is our open pipeline strong enough to support the target?
An opportunity report shows open pipeline by stage and expected close date: where value sits and when sellers expect it to close.
The example test-org report lists six synthetic open opportunities totalling $2.0 million. Every deal had an owner, an amount, a stage and a close date in this quarter or next. On its face, the pipeline looked well covered.
Adding Last Activity changes the conversation. This field reflects activity dates associated with the opportunity, including events and closed tasks; it is not a record-modification timestamp (Salesforce Help).
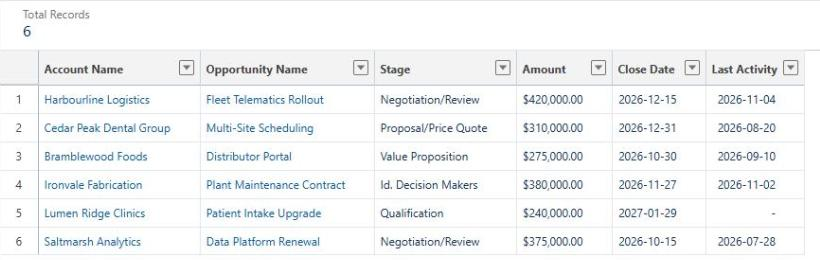
The $2 million pipeline includes deals with old or missing activity dates.
Only two deals, worth $800,000, show a Last Activity date within the past month. Three show older dates, one has no Last Activity date, and two open deals carry close dates that have already passed. The same $2.0 million total now reads less like coverage and more like a list of conversations to have.
What to question: An old activity date does not prove a deal is lost. The seller may be talking to the buyer by phone or email that never reached Salesforce (see the next example). A past close date may simply be an update nobody got round to. The report shows activity dates and overdue close dates; it does not establish whether other fields changed or why activity is missing.
How to investigate: Run a short exception report alongside the pipeline view: open opportunities with a past close date, or with no activity in the last 30 days. Review those deals with the owners as a routine, not an audit. For the forecasting implications, see three questions to ask before you trust this quarter's forecast.
Choose the inactivity threshold with the sales manager. A long procurement cycle may justify a quiet month; a promised follow-up that nobody completed needs attention sooner. Record the buyer's next step and its owner before changing the forecast. Last Activity alone cannot establish that a deal has progressed to a new stage, so check stage history or the seller's supporting evidence when progress is the question.
When outside help is worth it: when exception reports keep surfacing the same pattern and nobody can say whether the cause is process, missing automation or integration gaps.
2. The sales activity report that misses real work
Management question: Is the team actually engaging customers?
Activity reports count recorded calls, emails, meetings and tasks. They help identify coverage gaps, provided the relevant channels are captured.
In this illustrative activity comparison, Salesforce has six completed activities for the 30 days to November 8, compared with 15 interactions in a separate log of calendar meetings, mobile calls and messages. Nine are absent from Salesforce: the report captures 40% of the comparison total. Four accounts that look dormant have recent contact in that log. These are synthetic comparison figures, not evidence from a live calendar or phone integration.
The report counts what is recorded. Reading it as "the team is barely talking to customers" could lead to unnecessary activity targets or headcount.
The reverse problem is just as real. A high activity count does not establish that conversations were valuable. Ten quick, logged emails can look busier than one decisive meeting that was never recorded.
What to question: Which channels does the team actually use, and which of them sync to Salesforce automatically? Are meetings logged from calendars, or only when someone remembers?
How to improve it: Treat activity capture as a workflow design problem, not a discipline problem. Check email and calendar capture, defaults and required fields before adding reminders. Verify what your org stores and exposes in reports. Our article on why sales teams still do the work twice looks at reducing that duplicate effort.
3. Marketing leads versus valuable pipeline
Management question: Is marketing generating commercially useful opportunities?
Lead and campaign reports show volume: new leads, marketing-qualified leads (MQLs), conversion counts and lead source. They show which programmes create interest.
The trap is treating MQL volume as a proxy for revenue. Consider a quarter where marketing delivers 400 MQLs against a 300 target. Sales accepts 90, opens opportunities on 35 and wins 4. A volume report celebrates the quarter; a cohort view that follows the same leads through to pipeline and closed business tells a more mixed story. Neither report is wrong. They answer different questions.
MQL definitions and attribution rules are not universal. Each organization has to agree what counts as qualified, how sales acceptance is recorded and which touch gets credit. Without that agreement, marketing and sales can both be right about their own numbers and still disagree about performance.
What to question: Is the report counting leads created, leads accepted or leads that became pipeline? Are you comparing cohorts of the same age? Agree those definitions before comparing campaign performance.
4. Closed Won revenue versus accepted orders
Management question: Does Finance recognize the business Salesforce says we've won?
A Closed Won report shows which deals sellers have marked as won, when and for how much.
This illustrative order comparison matches four synthetic Closed Won opportunities totalling $250,000 with a separate ledger representing an ERP or billing system:
| Opportunity | Salesforce Closed Won | Order system status | Difference |
|---|---|---|---|
| Yard Sensors Phase 1 | $96,000 | Accepted, $96,000 | $0 |
| Spare Parts Program | $54,500 | Accepted, $49,800 (freight terms changed) | $4,700 |
| Hygienist Training Package | $38,000 | Rejected (billing tax number missing) | $38,000 |
| Dashboard Add-on | $61,500 | Not yet received | $61,500 |
| Total | $250,000 | $145,800 accepted | $104,200 |
Example data shows a $104,200 gap between Closed Won opportunities and accepted orders.
The $104,200 gap represents a changed amount, a rejected submission and a delayed handoff. Closed Won amount, booked orders, invoiced revenue and recognized revenue are different measures. They need not match on every date.
What to question: Which number is being used for the decision in front of you — commission, cash planning, capacity, board reporting? Who owns the reconciliation, and how quickly are rejected or changed orders fed back to sales?
How to investigate: Reconcile Salesforce with the order system and assign rejected records for repair. Our guide to Salesforce ERP integration mistakes explains the handoff and acceptance checks.
5. Two managers, two different numbers
Management question: Why do our reports disagree?
These screenshots show the same synthetic opportunity population with two close-date filters:
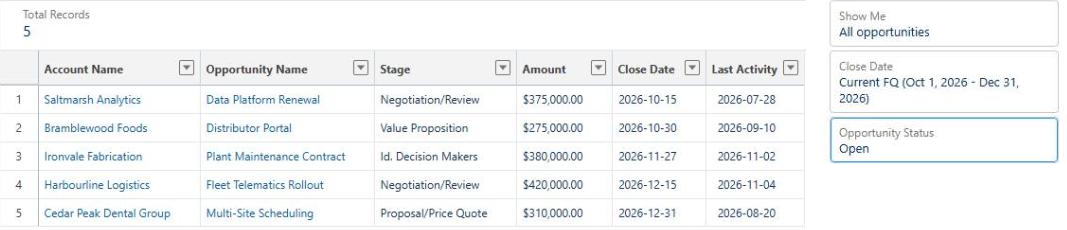
The fiscal-quarter filter includes five deals worth $1,760,000, including two with overdue close dates.

The rolling 90-day filter excludes overdue deals and includes January’s opportunity, reducing the total to $1,350,000.
Both managers could call their number "this quarter's pipeline". The fiscal-quarter view includes two overdue deals worth $650,000 and leaves out a January deal; the rolling 90-day view does the opposite. The totals differ by $410,000 because the date windows answer different questions.
Date filters are only one cause. Reports also run with the access of the person viewing them, so record sharing and field-level security can legitimately produce different row counts or missing columns for different users. Dashboards add another layer: a dashboard can run as a specific user, so everyone sees that person's view of the data, or as the logged-in viewer, so each person sees their own (Salesforce explains these options in its dashboard visibility guidance). Relative date ranges also shift as time passes. Check the dates displayed by the report; do not assume its UI range is identical to a similarly named SOQL date literal.
The screenshots support the filter discrepancy. They do not verify permissions or dashboard behavior in another org.
What to question: Before debating whose number is right, compare the two reports' filters, report type, running user and date basis. Our guide to Salesforce report types and common reporting traps covers how to define a report's population and measure so it answers the intended question.
6. Customer health outside Salesforce
Management question: Are we overlooking customers at risk?
An account report showing renewal dates, open opportunities and recent activity can make a customer look healthy. It is a reasonable view of the commercial relationship as Sales records it.
But many early warning signs live elsewhere: a run of urgent support tickets, falling product usage, late invoices or a reduced purchase order. If those signals never reach Salesforce, no report built on Salesforce data can analyze them. The account looks fine because the report has no way of knowing otherwise.
How to improve it: Decide which few signals matter, agree on definitions with Support and Finance, and bring a summarized version into Salesforce through integration rather than copying everything. A regular account review that checks those signals, owned by a named person, is as important as the data feed. Review whether the signals arrive on time and whether anyone acts on them.
Adding AI doesn't fix missing context
An AI summary may surface exceptions and suggest questions. Consider the chain above: incomplete activity data produces a plausible pipeline report. The report feeds a polished dashboard. An AI assistant summarizes the dashboard confidently — "pipeline coverage is strong; activity is low in four accounts." A recommendation follows that looks better supported than it really is.
This is a risk scenario, not a test of an AI product. Without access to independent evidence, the assistant cannot verify unlogged meetings or rejected orders. Ask what evidence supports the recommendation, however polished the summary.
Five questions to ask before trusting a Salesforce report
- Does the report answer the actual business question? A pipeline-by-stage view answers "where is value?", not "which deals are moving?".
- Is the relevant activity recorded in Salesforce? If key work happens in calendars, phones, support tools or billing systems, the report shows only part of it.
- Is the data complete and current enough? Check last activity, overdue close dates and blank required fields before relying on totals.
- Are the filters, permissions and definitions appropriate? Compare date ranges, "My" versus "All" scopes, the running user and agreed metric definitions.
- Have consequential figures been checked against independent evidence? For forecasts, bookings and board numbers, reconcile against the system that owns the outcome.
Use this checklist in your next pipeline review.
Bring us one Salesforce report your team cannot agree on
If the same reporting dispute returns every month, another dashboard may leave the cause untouched. Logic Conduit can help trace the definitions, data capture and system handoffs behind it, then scope a practical repair with your team.
Discuss your Salesforce reporting problem. In the contact form, describe the decision you need to make, which figures disagree, and which systems hold the supporting information. You do not need a technical specification to start.